Whenever someone wishes to prepare for a school exam or just acquire more knowledge about a subject, one must study what was written down beforehand. A practice test problem is meant to prepare a student for a future problem that wasn’t seen before, and technical analysis plays a similar role. With technical analysis, traders study price by studying what happened in the market earlier on to better understand what it will be like in the future. Therefore, traders will benefit by not being as surprised compared to those who have done no analysis and are entering/exiting blindly. Being able to suggest what the future trends and prices look like give many people an advantage in the trading world, showing how useful technical analysis can really be.
Charts visualization
The best way to technical analysis at work is through visualization and clear illustrations. Those who have went to school have seen all kinds of charts growing up. Charts help people see exactly what is going on and give them the ability to draw conclusions.
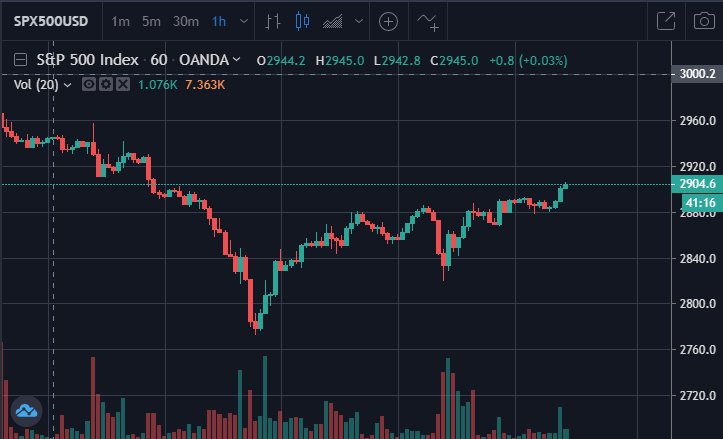
Charts in the trading market, like the one posted above, show a price of any given security over a certain period of time. Displaying this information on a chart allows people to make analysis, leading to more informed traders who feel more confident with their enter and exit strategy. While the price is listed on the y-axis, the duration of time is on the x-axis, with the prices being shown from left to right
Types of Charts
Line chart- Visualization of the closing, or the last price traded, over a given period of time
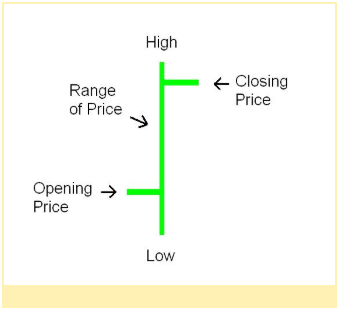
Bar chart – shows how the stocks have been traded over a certain period of time by displaying the Opening, High, Low, and Closing prices of a given security
Candlestick – This chart shows the same information that a Bar chart does, but in a different way.
The green candlestick shows the closing price was higher than the opening price, while the red candlestick shows that the opening price was higher than the closing price.

By looking at and studying these charts, traders can trade with more assurance and learn more from the mistakes that they make. Technical analysis is a tool that is very useful when used the right way, and the best way to use it is to study what has happened before and let the charts guide you through the process.
Next Article: