Internal backtesting systems often have core similarities in terms of components. The five most prominent components of backtest modules are explained in this section.
(1) Data Handler
A data handler is essentially a master database of historical and live market data. The interface contains data on financial securities such as stock and futures prices. The data must be live, as even the slightest pip movement may alter the backtester’s recommendations.
Common database systems include PostgreSQL, MySQL, and SQL, as well as HDF5 for storing larger files. These systems store tick data, which are upward and downward movements in price levels by the pip, and bid-ask spread information, which is the amount that the asking price exceeds the bidding price. Advanced data handlers take into account dividends and forward and backward adjusted stock prices. In order to limit survivorship bias, which is discussed in Chapter 3, data handlers must include delisted securities. Once the data is compiled, the time zones of the exchanges must be verified and standardized.
(2) Entry Event Generator
An entry event is a signal generated based on market data, news, or additional sources. Once new information is received from the data handler, the coded prediction mechanism produces trading signals. For example, the system may recommend purchasing the S&P 500 Index, which classifies as an entry event. In doing so, the prediction mechanism will perform an optimization to limit risk and minimize cost.
The backtester may have a risk management system to dismiss signals under specific circumstances. An example of a dismissal the system could issue occurs when the tested market has wide spreads, which could increase the execution costs.
(3) Strategy
Backtester providers typically construct a system that offers the ability to connect with multiple data sources. The strategy, which is comparable to the brain of the system, encompasses the core rules that traders use to trade and test.
In order to provide realistic estimated returns, the backtester must consider fees and slippage of trade execution prices, among other scenarios.
(4) Result Metrics
In order to generate a robust trading infrastructure, several performance metrics must be identified and examined. Backtest programs often have live indicators of the values of these metrics, which are generated from the three prior backtesting components.
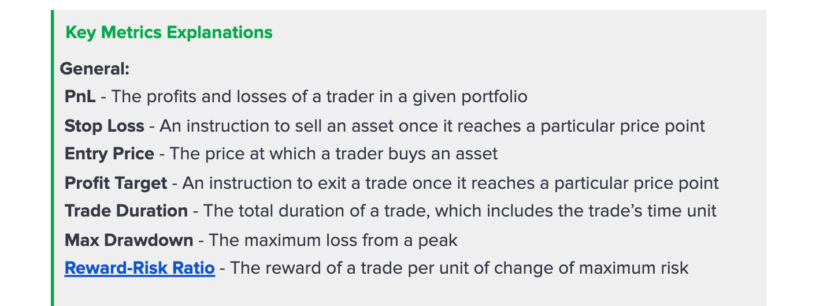
These metrics can help traders analyze their performance and decide whether to issue trades. The explanations of the key result metrics are described below in Figure 6.
Key Metrics Explanations
General:
PnL – The profits and losses of a trader in a given portfolio.
Stop Loss – An instruction to sell an asset once it reaches a particular price point.
Entry Price – The price at which a trader buys an asset.
Profit Target – An instruction to exit a trade once it reaches a particular price point.
Trade Duration – The total duration of a trade, which includes the trade’s time unit.
Max Drawdown – The maximum loss from a peak.
Reward-Risk Ratio– The reward of a trade per unit of change of maximum risk.
Advanced:
Average Latency – The time for a market data system to collect information.
Alpha – Measures a given stock’s performance relative to a benchmark index.
Beta – Measures a given stock’s price volatility relative to the market.
Benchmark Comparison – The standard performance of securities.
Cost per Trade – The amount a broker charges per trade.
Figure 6
(5) Optimization Model
An optimization model defines the ideal parameters to utilize for a trading strategy. Optimization is conducted on the signal to entry (triggers) and the execution, which consists of the stop loss, time in the market, and profit targets, among other metrics shown in Figure 6.
Backtesting platforms conduct optimization to tune each variable to identify the most profitable and sustainable combinations. For instance, a trader may find that trading at 10 A.M. is particularly effective. However, the trader wants to optimize the profits gained, so the person backtests all possible times that the market is open.
The backtester may discover that the ideal time to trade under the person’s particular strategy is 11 A.M., in fact. The trader has effectively tuned and optimized the time variable through the use of a backtester. The model could optimize many internal variables of the execution strategy. This is an immensely simplistic example and is provided strictly to illustrate the concept of optimization.
When optimization is run on all possible variables (time of day, stop loss, profit targets, etc.) to generate a model, the tuned variables increase the liquidity of trades and maximize the trader’s efficiency.
Continue to the next part of our backtester series here.