BetterTrader offers a specialized backtesting system that interprets market data in real-time. BetterTrader’s artificial intelligence algorithms allow traders to improve their market analysis. The backtesting system avoids the aforementioned pitfalls discussed in Chapter 3.
Avoiding Backtesting Pitfalls using BetterTrader
BetterTrader’s backtesting system avoids the aforementioned pitfalls discussed in Chapter 3. BetterTrader’s data handler contains a complete database of historical events and developments. This database includes data on even extinct companies, thereby excluding survivorship bias. Therefore, data selected to be in the training set is representative and captures a complete picture of historical events. The artificial intelligence algorithms account for not only expected value but also volatility, skew, and max drawdown. As seen by the risk and historical success ratios, the backtester takes into account unexpected risk. BetterTrader’s backtesting system bypasses the issues experienced by individuals and other backtesting systems.
Specification of Economic Event
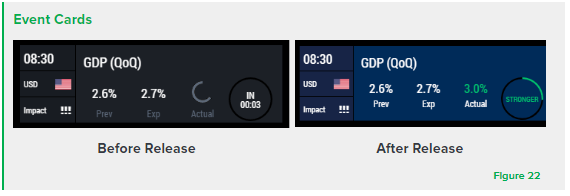
BetterTrader, through the use of the economic calendar, generates event cards for every economic event. The cards specify the currency of the country the event is based in and ranks the data in tiers based on impact and volatility. The difference between the actual and the expected release value drives the market and allows traders the opportunity to make profitable trades. BetterTrader denotes events where the actual release value is higher than the expected value as a “stronger” event (Figure 22).
Impacts of Price Actions and News
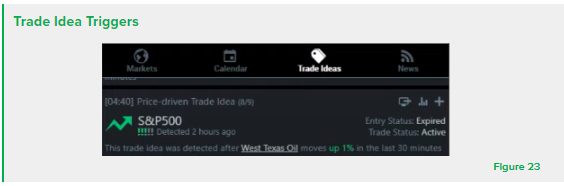
From the event cards, BetterTrader’s backtesting system may generate triggers for trade ideas. For example, a trigger was generated for the S&P 500 after West Texas Oil moved up 1% thirty minutes prior. The price-driven trade idea reached its profit target eight out of nine times and reached its stop loss only once out of nine times.
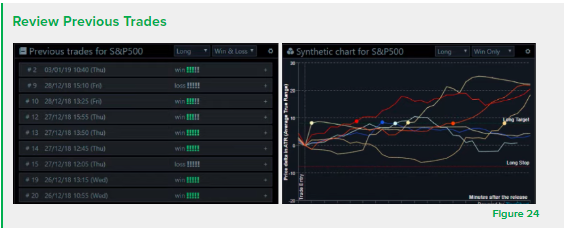
For each trigger, BetterTrader allows traders to examine market reactions each time the trade idea happened in the past (Figure 24). By viewing the market reactions in a synthetic chart, traders can recognize patterns of the market and gain clarity on their trades.
Backtesting Example
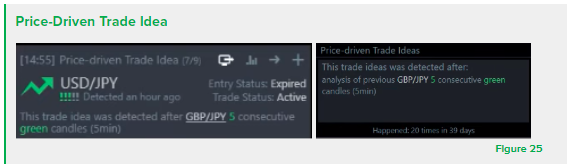
After GBP/JPY experienced 5 consecutive green candles, BetterTrader detected a price-driven trade idea for USD/JPY, as shown in Figure 25. Following a similar release, USD/JPY moved up seven out of nine times (78%).
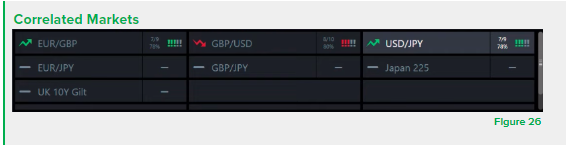
By analyzing correlating markets, BetterTrader provides traders with the knowledge that some instruments are not beneficial to trade following price movements. For example, Figure 26 displays that trading EUR/JPY, GBP/JPY, Japan 225, or UK 10Y Gilt following the movement of GBP/JPY is not statistically backed. The total quality of the trade is represented by the exclamation points and describes both the risk and potential profitability. BetterTrader provides customization capabilities to effectively visualize backtesting results.
BetterTrader provides the following customization capabilities to effectively visualize backtesting results: real-time chart, previous trades, latest trade, synthetic chart, and trading card. These tools allow traders with the market data needed to make trading decisions about the instrument being backtested.
CUSTOMIZATION WIDGETS Real-time Chart What is this widget? Use real-time market data to keep an eye on market developments of the instrument that you are backtesting. Benefits 1. Stay focused on the market while you’re doing your research. 2. Plan in advance how you will apply that research into that market 3. Use many analysis tools to measure and analyze the trade idea yourself using your individual trading strategy Previous Trades What is this widget? See how the market reacted every single time that trade idea happened in the past. Benefits 1. Identify when the best timing for entry and exit is. 2. Estimate what degree your loss or profit is likely to be. 3. Detect whether you should wait more after passing the profit target to gain much more or whether you should just exit. Latest Trade What is this widget? See how the market reacted to any trade that was released today. Benefits 1. Get instant results not from the past, but from today’s market reaction to that specific event. 2. Detect whether today’s event market reaction still correlates to its past market reaction history, and gain confidence into the next trade idea. Synthetic Chart What is this widget? The synthetic chart is one of the most powerful and helpful tools traders can have. See the executive collective results of the market reaction to a specific event, all in one specific chart. Benefits 1. See them all together – recognize the pattern of the market. 2. Get clarity and confidence on whether you should enter the market with that specific trade idea. Trading Card What is this widget? A snapshot of the historical behavior for winning trades for specific trade ideas. Trade cards include profit targets, stop loss and many other useful metrics. Benefits 1. Get clarity for the trade iea all in one simple card. 2. Manage precisely the expectation of what is reasonable to get from this trade. 3. Keep your risk bound with well informed stop loss that is tested. Figure 27 |
Continue to the next part of our backtesting series here