Pivot points are used by traders in equity and commodity exchanges to better predict future prices. Pivot points are calculated using previous prices in order to predict future entry and exit points. These future entry and exit points are calculated using technical analysis, and are used to determine overall market trends over different time periods.
Calculating pivot points involves taking the averages of previous price data, typically consisting of the high, low, and closing prices. This pivot point number is then used to determine market sentiment in reference to a security; trading above the pivot point is an indication of an ongoing bullish sentiment, and trading below it is considered to be a bearish indicator. In essence, the pivot point serves as an indicator of direction to where traders should place long or short positions.
The basic five-point system calculation derives a pivot point from the previous day’s high, low, and closing price to advise short term moves in market sentiment. Using these data points, support and resistance levels can be extrapolated upon to give further indications of where the price might be headed.
Calculations for the five-point system:
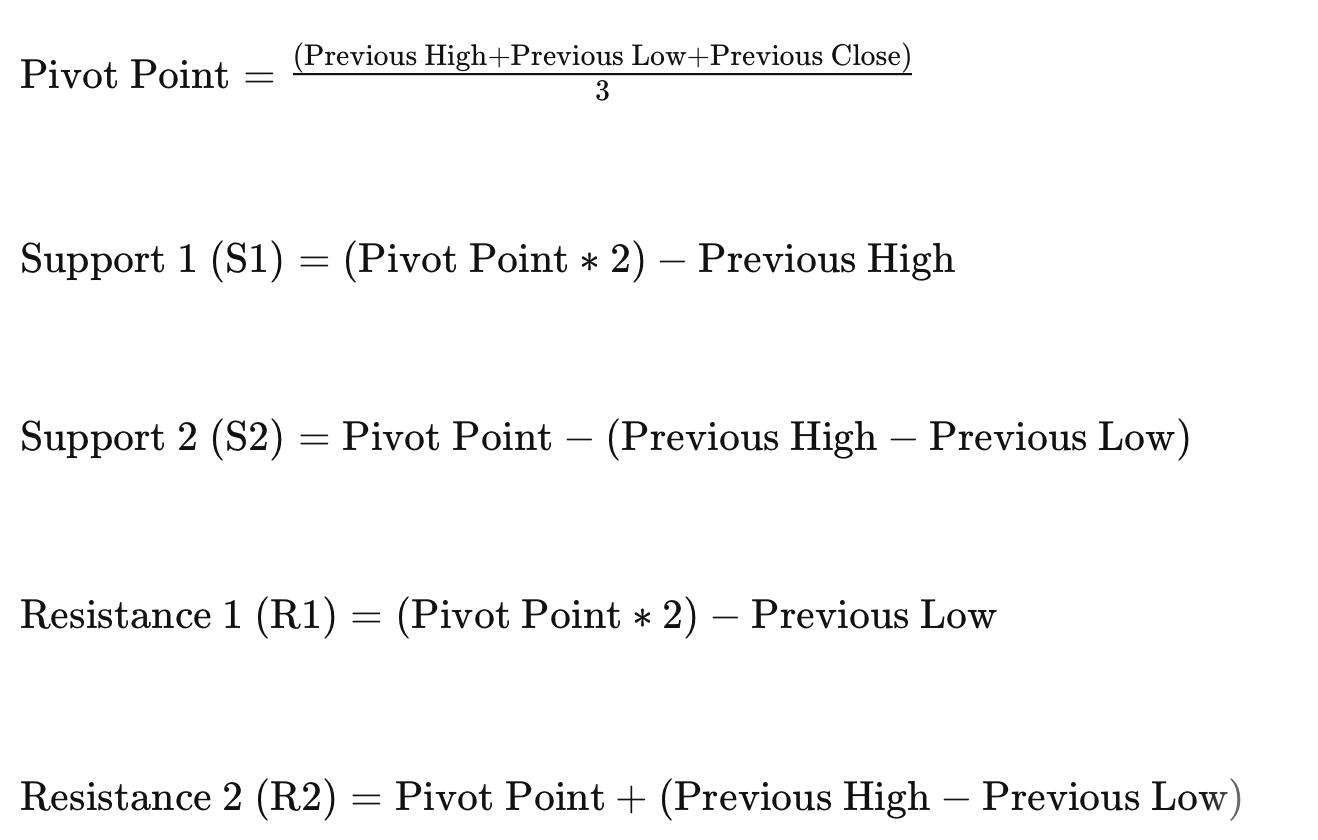
The pivot point calculation depicted in the first equation is simply the average of the previous day’s price points. This value can then be used to calculate both magnitudes of the support and resistance levels. Resistance levels are a price ceiling which, if broken, may indicate a new bullish trend. Support levels serve the inverse function in that they define a price floor beneath which a new bearish trend is likely to occur. Conversely, securities which approach support/resistance levels but do not cross them are often poised for a reversal in direction rather than a continuation. In general, when the price of an asset is trading above the pivot point, it indicates the day is bullish. The additional support and resistance levels offer confirmation of market sentiment, thereby providing more robust data when the price hits both levels of either respective indicator.
The pivot point itself is a median reference point, indicating the magnitude of price movement required to suggest a meaningfully bullish or bearish market sentiment. Having said that, market movements are not bound to any daily range and therefore require additional analysis by traders. For instance, constructing pivot points based on a prior day with no significant news events and minimal volatility would not be particularly useful if the present day is loaded with high-impact news events. That is, if yesterday was abnormally calm (low volatility) and today is filled with rapid market movements (high volatility), the usefulness of pivot points will diminish. Furthermore, the higher the resistance level or the lower the support level, the higher likelihood of further momentum in that direction.
The formulas shown above represent the basic calculations used for a pivot point, typically referred to as the “standard” pivot point. There are a variety of additional approaches with more complex calculations and results. There is no one best method, but rather different approaches of framing and interpreting market movement. The main point is to work with a pivot point that best matches one’s investment strategy and risk comfort.
An additional equation, extrapolated from the “standard” model, is shown below to decrease risk by analyzing further price data from previous days:

This equation introduces the opening price of “today” as a data point to factor into the pivot point calculation process. Introducing the opening price will theoretically increase the robustness of the pivot point. When more numerical information is added to the equation, it reduces risk, but also dilutes the pivot points capacity to predict smaller market sentiment trends.
Continue to part 2 of our pivot points series here.