In the world of trading, analyzing trends and price changes are two very important things traders focus on to gain profit. Trends allow traders to predict future prices and how they would change.
Two types of trends that exist in the market today are uptrends and downtrends. Each type of trend tells a different story and has its own impact on a traders success in the market. While uptrends show a series of higher highs and higher lows, downtrends show lower highs and lower lows.
Act in real-time with BetterTrader – Learn more>>
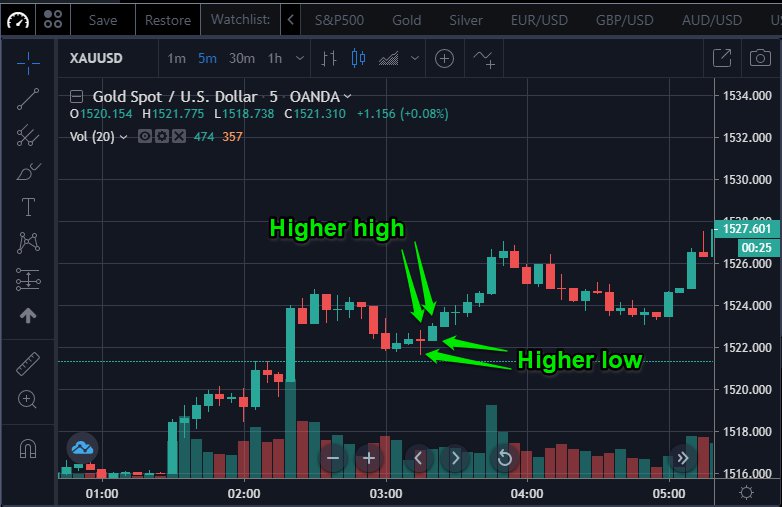
Higher highs and higher lows
When the peaks and troughs are ascending on a chart, and uptrend can be seen happening. In that uptrend, prices can be seen as higher highs and higher lows. As the uptrend is occurring, prices from the previous period that were seen as highs are even higher than they were before. Not only do the highs finish higher, but the lows from a past period of time increase in value and end up being higher than before. This tells a trader that prices are rising and the overall value is as well, indicating that it is time to sell and make some profit while they can before a downtrend occurs.

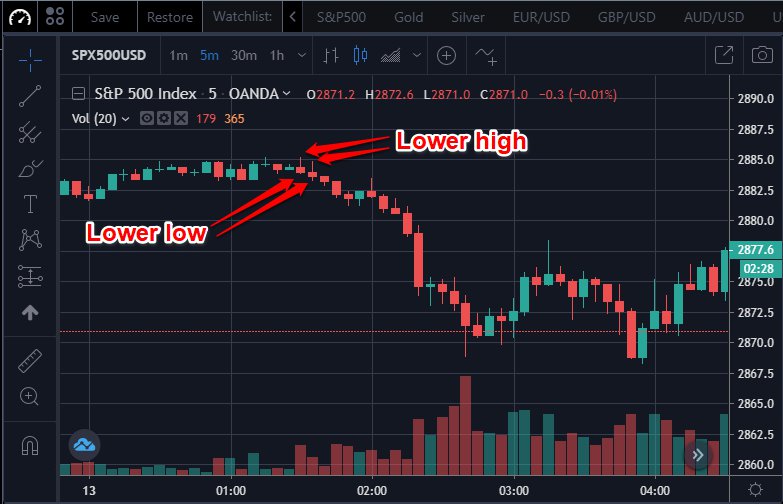
Lower highs and lower lows
In contrast to overall increase in value that an uptrend indicates, downtrends can be seen with the descending peaks and troughs that a chart shows. Therefore, the change in prices show lower highs and lower lows. During a downtrend, prices that were higher in value decreased the following period, showing the lower high concept. In comparison to higher prices finishing lower, lower prices change negatively and become even lower in the next period of time on the market. Traders can take away from this that the overall value is decreasing and that it may be time to buy and implement an entry strategy just before a potential uptrend occurs, indicating an increase in value and which would result in a profit.
How to use this technical indicator
Higher highs and higher lows indicate that an uptrend is occurring with the overall increase in the value of the instrument, while lower highs and lower lows can be seen in downtrends and show a decrease in value.
Traders analyze this information to make future decisions and predict potential changes in trends. The ability to accurately forecast changes in price by looking at both higher highs and higher lows, as well as lower highs and lower lows, gives one the chance to create and implement an effective enter and exit strategy.
Act in real-time with BetterTrader – Learn more
Next Article:
Meet AI-Trader Copilot: Your Ultimate Trading Assistant from BetterTrader.co