


Gold and Silver have been two of the most stable commodities in the Forex market since their discoveries. They have served as currencies and expensive material for projects for thousands of years. Since 2017, both gold and silver have experienced major troughs in their market value only 3 times. These markets have shown to be very stable and increase in value. Just as Gold has been reaching record highs, silver has come close to recovering from a long bear market. Both of these commodities have been generally increasing in the past 3 years, and many experts speculate Gold and possibly silver are headed for record highs. The relationship between the two metals is fascinating, and will be discussed below.
Gold Silver Ratio
The definition of the gold/silver ratio is a measurement of the relative value of each metal. The gold/silver ratio is measured by simply dividing the gold spot price by the silver spot price. Since these two assets have tended to be highly positively correlated, the gold/silver ratio is used to indicate which metal is more fairly priced at any given time. For instance, if the gold/silver ratio is extremely low relative to its historical average, traders seeking precious metal exposure may buy gold. If it is extremely high relative to its historical average, traders may buy silver. Either way, traders are choosing which metal to buy based on an expectation of reversion to the mean within the gold/silver ratio. Over the last 3 years, although the ratio has fluctuated, there was a progressive increase in the ratio until it collapsed in 2020. Now, the gold silver ratio is close to a five year low.
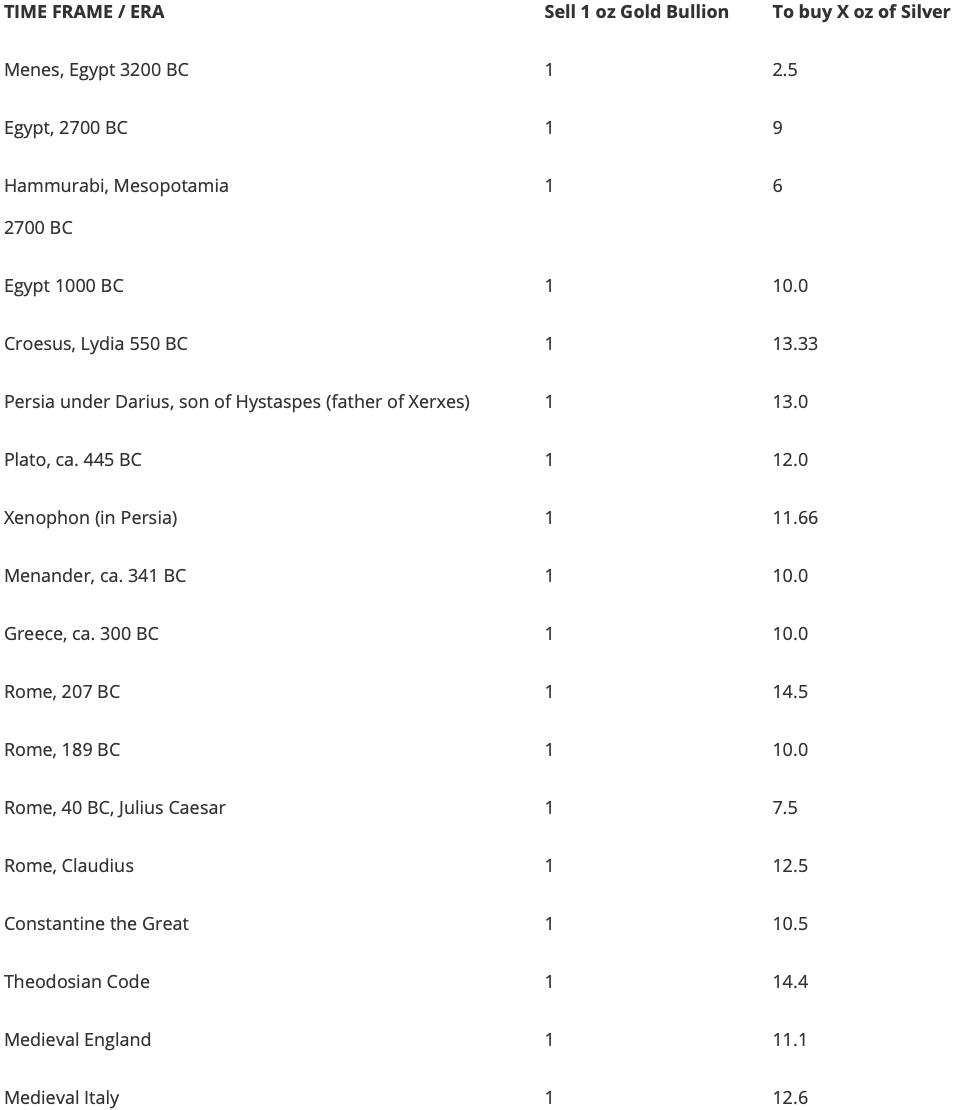
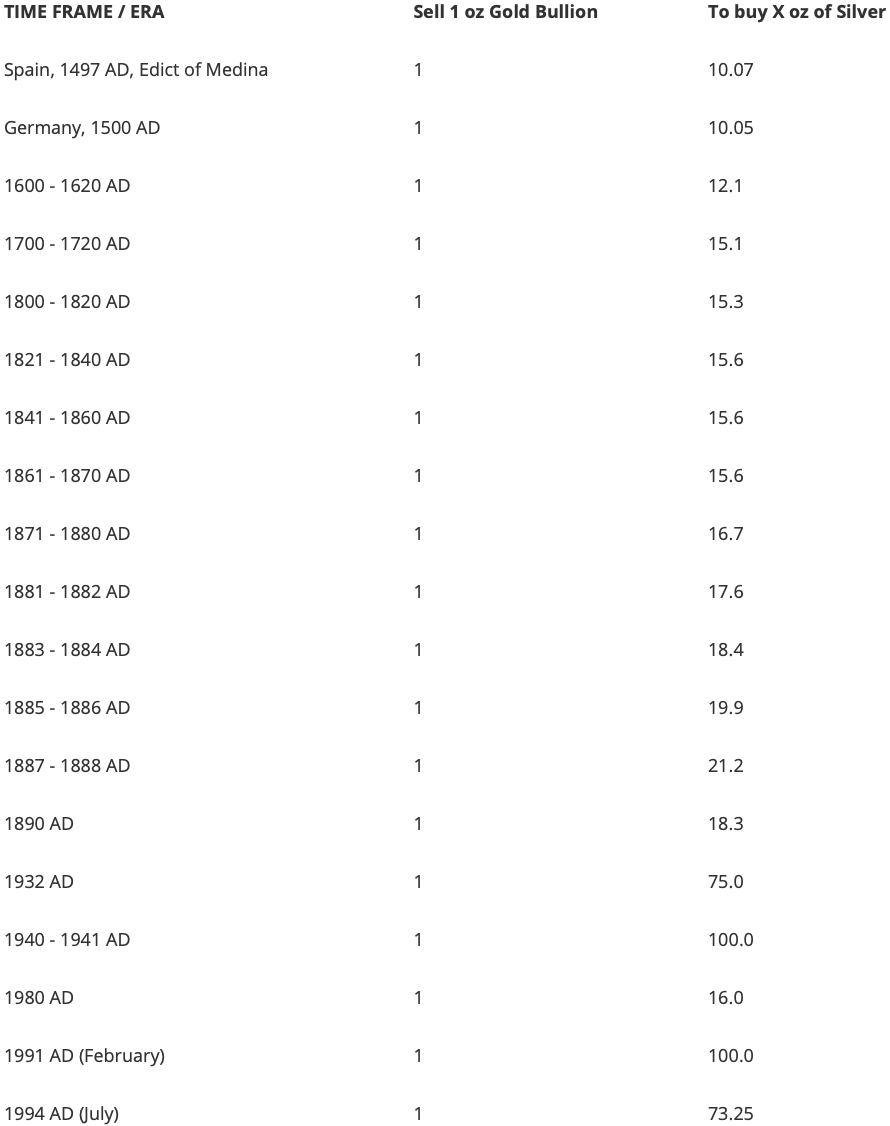
Since the early Egyptians, gold and silver have been some of the highest regarded commodities in history. In ancient times, silver was almost worth as much as gold. In Menes Egypt for example, gold was only 2.5 times as valuable. In 1940, gold reached its highest price against that of silver, trading at a multiple of more than 100 times silver. The gold/silver ratio reached 100 again in 1991, before falling to 73 in 1994. Charts of the Gold Silver Ratio history are provided below:
History of the Gold Silver Ratio
Gold Silver Ratio in the Past 3 Years
The gold/silver ratio has fluctuated in both directions since gold and silver were first discovered. However, in the past 3 years, the gold/silver ratio has changed incredibly. Between mid-2017 and a few months into 2020, the ratio fluctuated anywhere between about 75 to about 123. In February of 2020, the ratio increased dramatically, reaching a peak of 123 on March 19th from its previous low of about 88. The 123 ratio has since decreased to a level of 73 as recently as August 17. Yet, between February 18 to march 19th, we saw a 36 point difference in the ratio for the largest increase in any period over the last 3 years. As quickly as there was an increase, on about May 5th began the decline of the ratio from 115 to as low as 96. However, this wasn’t the largest decrease during the period, and that came from the following trough we are currently engaged in which began around June 24th at about a 98 ratio, to about 80 towards the end of July.
As previously mentioned, the gold/silver ratio is currently at a level of 73 (August 17th) but in about a 2 month period, we saw a 36 point increase and a 43 point decrease between mid February to the end of July. This is easily the most active the ratio has been in the 3 year period in terms of its volatility, and sheds light on how much the ratio and markets of gold and silver can fluctuate. The gold/silver ratio may not directly tell traders how valuable either of the metals are in the market, but they can provide a reference point with historical context for determining future values of the metals.
The third image, or figure 3 is a graph of the gold to silver ratio for the past 3 years, which will show the details explained before in a line graph. Through the charts, gold seems to continue to increase relative to silver. The gold to silver ratio is nearly three times higher than it was one-hundred years ago. Despite its recent collapse, the broader historical trend has been to move higher, clearly favoring gold. Short-term traders, however, may seek to capture deviations from that trend, as occurred over recent months. For example, traders can directly bet on the ratio rather than the metals themselves through taking a long position in one metal and a short position in the other. A trader expecting the ratio to decrease would take a long position in silver and a short position in gold, while a trader expecting the ratio to increase would do the opposite.
Gold and Silver Correlation
According to the definition of correlation, “A statistic that measures the degree between two variables that move in relation to each other,” gold and silver may correlate one another. Silver’s primary role is in industrial sectors, and its role as money in the market is secondary to its practical uses. Gold, on the other hand, has its primary role in its use as money while its industrial use is secondary to its monetary value; this is part of the reason that the value of gold per ounce as mentioned before, averages around 86 times more than silver. Gold’s value has increased considerably over the past one hundred years, and most of the increases have come in the past 50 years.
Silver has declined in value over the past one hundred years, so much so that the value of silver is actually cheaper than what it was a century ago. Silver’s inflation-adjusted price and its real value have reached below its price point from what it was one hundred years ago, and this has been the case in fact for 84 of the past 100 years. The two times in the past one hundred years when the price of silver moved similarly with gold came when gold was responding to accumulated losses in purchasing power of the US dollar (Williams). Gold’s increase in price and value are inversely related to the decline in the value of the United States Dollar. Gold can be used as real money and was the original measure of value for all goods and services in the United States and other countries throughout history. However, the United States dollar is a substitute for gold in the modern day since gold hasn’t backed the dollar since 1971 during the Richard Nixon administration, rather than a direct form of currency.
There is already an established association between Gold and the US dollar, rather than that to silver. Gold’s higher price over time reflects the ongoing loss in value of the US dollar, which is also known as the purchasing power. The more the US dollar loses in value, the more the price of gold will appreciate. Now back to the debate between gold and silver, are the two correlated with each other? Any association or correlation between the two metals is limited in nature simply due to the differences in each of their fundamental roles. The history of the price of gold is indicative of the association and inverse relationship with the US dollar. Silver prices seem to more so reflect the white metal’s primary use as an industrial commodity versus having a primary function of monetary value. For these reasons, gold and silver aren’t should not be expected to move perfectly in tandem.
Conclusion
The relationship between gold and silver is quite interesting, especially in their market trends over the course of the last 3 years. What’s known as the gold/silver ratio is a proportion of the values between the two metals. Since the discovery of both metals, gold has always been valued higher than silver anywhere from 2.5 times to over 100 times more valuable. Gold currently is about 73 times more valuable than silver, but as we’ve seen that number can quickly change. Recently, we saw the ratio move from about 96 to 123, then from 115 back down all the way to 73.
Although the gold to silver ratio may not be able to outright tell someone the value of either of the metals, traders can take what they see in the ratio chart and determine whether they believe gold or silver is going to appreciate or depreciate in value. When it comes to a correlation between the two metals, it is important to note the primary functions of gold and silver in the marketplace. Since the dawn of its discovery, gold has been or a part of a currency, most recently backing up the US dollar in the United States. The primary function of gold is its monetary value, even though the US stopped using Gold to back its dollars during the Richard Nixon administration. Gold’s secondary and tertiary functions include industrial applications.The primary function of silver is its industrial application. Due to their differences in primary functions, it wouldn’t make sense that they would correlate perfectly, however, some degree of correlation is to be expected given that they both possess some degree of monetary usage. In terms of gold, it may make more sense to inversely correlate gold and the US dollar due to gold being a substitute for its currency.