Backtesting is the process of testing the effectiveness of a trading strategy through the use of historical data. Backtesting is founded upon the premise that securities, historically, move in relatively similar patterns. Given market trends, traders employ backtests to forecast economic movements and assess the risk of their strategies. Backtests allow traders to solidify their convictions and make informed decisions.
In order to assess the validity of trading strategies, backtests examine not only profitability and risk but also volatility, return, and market exposure, as shown in Figure 1. Backtests attempt to ensure that traders incur greater wins than losses by issuing profitable exit and entry signals. They establish lucrative dynamics because they are founded upon the basis that historically ineffective trades are likely to yield similar results. Equally, past trades that rendered profit may have similar outcomes, too. This dichotomy allows for the opportunity for traders to make profits, an exciting prospect.
Common Backtesting Measures
- Volatility – A measure of the variance of a trading price over a period of time
- Return – Gain or loss on an investment over a specified period of time
- Risk-Adjusted Return – Financial performance, or return, adjusted for risk
- Market Exposure – The amount invested in a particular market sector or industry
[Figure 1]
An effective backtester will analyze trading strategies like market trends, swings, and conditions. Traders will understand the expected market movements, which provides certainty around their trading approach.
Movements are anticipated from the following:
- Economic Events (news-driven triggers)
- Price Movements (price-driven triggers)
- External News Resources and Events
When coupled with various triggers (macro news, price action, external events, etc.) and market reactions, backtesting strategies allow traders to optimize other metrics like stop losses, profit targets, duration of trades, and volatility, among others.
From the aforementioned movements, backtesting programs can construct risk/reward ratios for each trade. Ratios can be continuously kept profitable by the implementation of stop losses, which keep losses to as minimal as necessary. If rewards far outweigh the risk, traders may have their strategies supported or contradicted, with both scenarios providing valuable information. When they use their trade plans in tandem with the historical market data provided by backtesters, traders may effectively revise their strategies for the future based on past market conditions. Although past performance cannot be used to predict future results, historical market reactions provide a systematic approach for traders to test and analyze their strategies.
While traders utilize and implement the analysis provided by backtests, the backtester itself is constructed by programmers. They perform simulations on instruments (stocks, bonds, ETFs, currencies, and commodities) to assess market movements and returns.
An effective backtesting model has a representative sample of instruments and, oftentimes, requires a census of all economic events. The created backtester will ideally identify trends in the data such as correlations between economic releases or market movements and bullish/bearish patterns.
The backtester may also be coded to identify patterns using key level zones, support and resistance levels, trendlines, and Fibonacci retracements. Signals the backtester produces, ultimately, go through rigorous tests to determine their statistical validity. A specialized backtester will conduct the required market analysis, which optimizes the time spent by traders and analysts.
Signals the backtester produces, ultimately, go through rigorous tests to determine their statistical validity.
Key Idea [Figure 2]
The strategies a backtester uses to issue signals can be generated from historical data using a training and test set. The training set is constructed of data divided over a specific period; on the other hand, the test set consists of slightly fewer data points over a more recent period of time. The trading strategy may be hypothesized by using only the training set. Then, the strategy will be applied to the test set to view its effectiveness. If the strategy produces a portfolio with a profit over time, then the strategy is effective. This process of simulating historical data to generate equity curves is a common way to backtest and evaluate the effectiveness of a strategy.
What is an Equity Curve?
An equity curve represents the financial performance of a trading account over time plotted on a graph. If the graph has a positive slope, the trading account tends to be profitable. If the graph has a negative slope, the trading account tends to be unprofitable.
Moving averages may be applied to a trader’s equity curve. A common rule is to stop trading if the equity curve falls below the moving average. Once the curve is above the moving average, traders may resume.
Backtest platforms allow traders to see a visual representation of their equity curve for each implemented strategy. A sample equity curve is shown below.
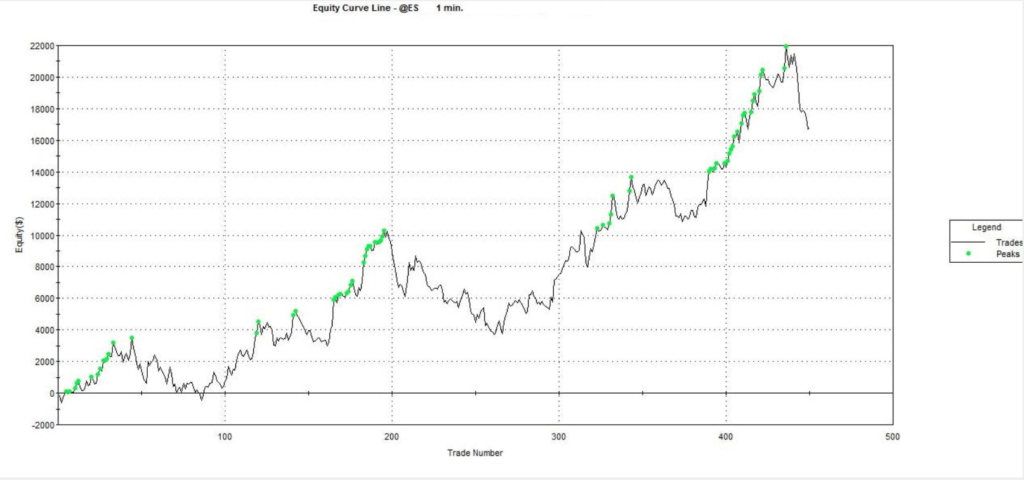
[Figure 3]
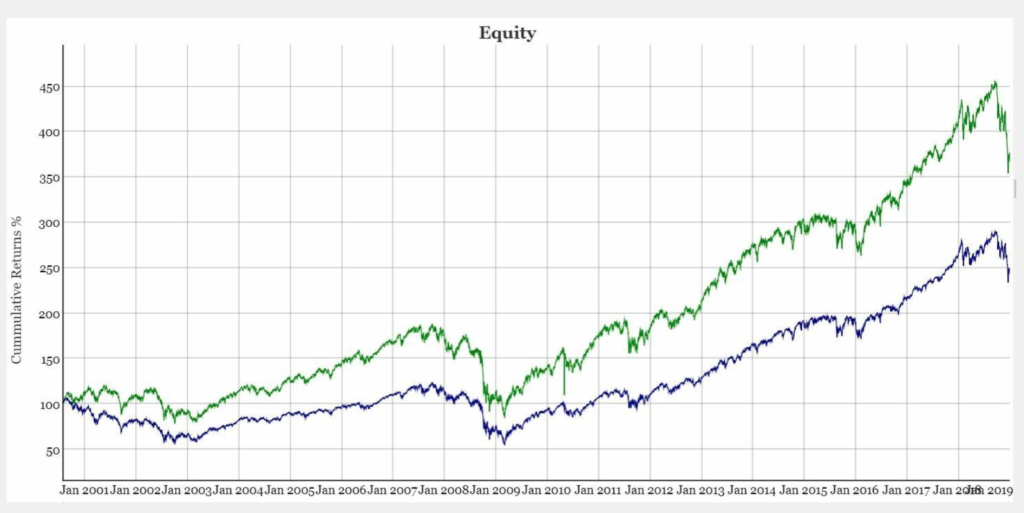
In a study conducted by Seeking Alpha, researchers devised a backtesting strategy given the following funds: IVE, IVW, IJK, and IJJ. They constructed countless algorithms in an attempt to outperform the S&P 500 Index, a standard benchmark for the success of the market. The rules of the algorithm they found particularly effective was to invest, during each month, in two out of the four funds that achieved the highest 3-month performance.
This algorithm is their trading strategy. The development of a strategy typically begins with an idea of the future conditions of a market. This idea is stress tested against past market conditions using a backtest. If the strategy proves futile, traders will stress test another strategy. If there is both low volatility and risk associated with a given strategy, traders may choose to implement it using their capital. The program would automatically set stop-losses and profit targets throughout the course of the study.
The backtested model, as shown in green in Figure 3, resulted in cumulative returns of 267.11% since 2000. This strategy outperformed the S&P 500, which has cumulative returns of 143.45% since 2000 and is shown in blue. Intuitively, by analyzing historical results, backtesting software grants traders the ability to make informed decisions about a future market.
Continue to the next part of our backtesting series Why do Traders Perform Backtests?