When someone enters the world of trading, one of the first things they need to do is to become familiar with candlestick charts and what they represent. During this learning process, traders may wonder how they can use the information they acquire to start off hot on the market and make a decent amount of profit. Before that is possible, it is important to learn about candlestick reversal patterns and how to identify them on the chart itself. This allows traders to make smart decisions and plan out their trading strategies so that they can get the most out of the market.
Analyzing Candlestick Price Patterns
The doji, hammer, engulfing, harami, kicker, piercing line, dark cloud, morning star, evening star, and shooting star are some examples of patterns that traders learn to interpret to trade with more confidence. The two reversal candlestick patterns that we will talk about as an example of learning how to analyze are the hammer and the shooting star.
Hammer – not the tool
The hammer is a candlestick formation that forms a bullish reversal pattern that mostly takes place at the lower end of downtrends. The creation of this formation occurs when the high, close, and open are around the same price. This can also be seen on the candlesticks where the lower shadow is around twice the size of the real body.
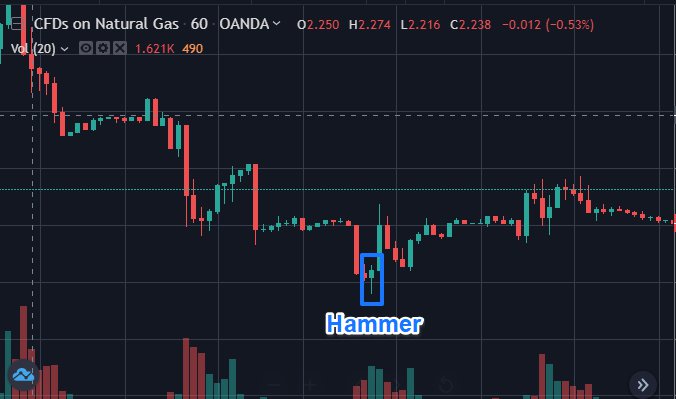
With the high and close being so close to one another, this indicates a very bullish behavior that rejected the bears, showing how much higher the price ended up being compared to the opening price. The hammer helps traders identify the potential end of a downtrend and where demand and support would be located. This is very important in analyzing reversal patterns as this signals to traders to buy more as the value of the particular security or stock is expected to go up.
Shooting star
This formation forms a reversal pattern that behaves bearishly at the end of uptrends. When the low, open, and close are so close to each other, this formation is created and is also identifiable because of how long the upper shadow is.

The real body is about two times less in length compared to the upper shadow that is formed. At the location of the shooting star, traders are able to see where the resistance and supply is, signaling the potential end of an uptrend and possibly the time for an exit. Traders are more informed when seeing this type of pattern occur and use this to prevent potential losses they may incur by not implementing their exit strategy.
Summary
Analyzing reversal candlestick patterns are essential in becoming a better trader and identifying opportunities to trade more efficiently. Learning about the basics of candlesticks may be the priority for beginners at trading, but taking the next step for ambitious traders is key and that starts with learning how to analyze formations like the hammer and the shooting star. While these two formations prove to be important, there is even more out there to learn to become the great trader you want to be.
Next Article: