Often times when examining and analyzing trends, traders want to remove any unnecessary data that make a chart difficult to read. To do this, traders calculate the average of price data over a specific amount of time. In the calculation, only the latest price of the given time period is used in calculating the moving average. Therefore, as each day passes the price data that is being averaged progress. After doing this for a certain period of time, a line is used to connect all of these averages, giving us the moving average.

On a chart, trendlines are drawn outside of price changes. Moving averages are also seen as trendlines, but unlike common trendlines, they are drawn over the changes of price automatically, taking away any possible influence from the drawer. This helps even out price changes and gives traders a more broad perspective on how prices are behaving and what possible future trends there might be.
Moving averages also help traders recognize any potential support and resistance zones. During traders early days, this would open up their eyes to more than just the basics of technical analysis. The ability to forecast future changes in price and trends put them ahead of others that are just starting, as well as those who are just not aware of these concepts.
Using Moving Averages
Knowing how moving averages work and where they come from is very important, but being able to apply this knowledge in real-life trading situations is the next important step. As said before, the moving average is drawn over, not outside, the line chart that indicates changes in price.
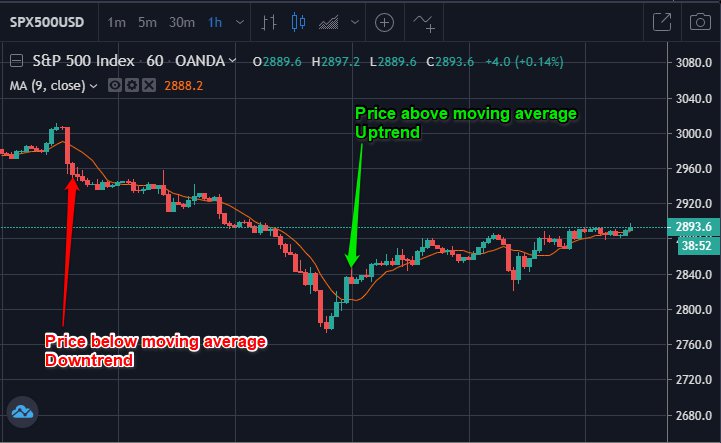
Uptrend and Downtrend
When the moving average line is rising from left to right, and an upward trend is taking place. When the moving average line intersects the price line as it is moving up, the rate at which it is rising increases. As soon as the moving average line crosses the price line as it is going down, the pace decelerates. Soon after, the moving average line may change from a positive to a negative sloping line, indicating a downward trend. It will be seen as a line moving from top left to bottom right. When the moving average line crosses the price line as it is decreasing, the pace as it is falling increases. The rate at which the moving average line falls decreases when the line crosses the price as it is increasing.
There are also times when price changes are abnormal. This signals that it is better to include two moving averages instead of only one. Trend changes aren’t only represented by the price intersecting and moving over the moving average, so the double crossover method is used. A long term moving average is calculated for a longer time period, and the same is done for the short term moving average. For an uptrend, the line representing price, short term, and long term line are almost parallel to one another at the start. Later on, it can be seen that the short term line supports the price, while the short term line gets support from the long term line. In a downtrend, the price, short term, and long term line starts in the same order as an uptrend does, except the starting point is from the bottom. The short and long term lines then act as resistance lines once prices begin to rise.
The concept of moving averages prove to be an important one for traders who are looking to get the most out of trading. It gives traders a more general overview of how prices are behaving while providing a different perspective. Being able to forecast future price changes and trends are important, and moving averages help out with that in a huge way. Using two moving averages while identifying support and resistance zones further enable traders to make smarter decisions when it comes to irregular price changes. Be careful not to overlook this powerful tool, as it will open up your mind and give you a new view of trading.
Next Article: