Day trading involves a lot of technical analysis. Technical analysis is the art of dealing with graphs and looking for different trends. The chart below will help us understand some of the keywords in day trading.

Definitions
- Resistance is when the asset being traded hits a certain ceiling and bounces back down because of external factors like consumer confidence, business outlook etc.
- Looking at resistance levels can give traders an insight into when the next price reversal will hit.
- Following this trend of constant resistance, once the asset breaks through the resistance, it is called a breakout.
- The opposite of a breakout is a breakdown which is when it breaks through during a bearish position rather than bullish.
- These definitions will help in explaining scenarios involved with day trading.
Bullish Market
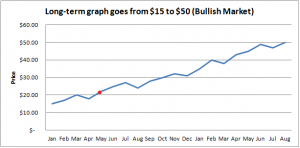
*** Buyers are in a strong position because they have already made significant profits if they bought anywhere on the graph.
Scenario #1:
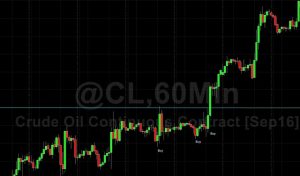
Judging from this graph, there are two times the asset decreases in value because of resistance. For a buyer, the best position to buy would be at the times when the graph comes down after the resistance because it is usually followed by another upward trend. After the asset breaks through, it would also be a good time to buy because most investors will also buy, causing the price to continually rise in the short-run.
Scenario #2:
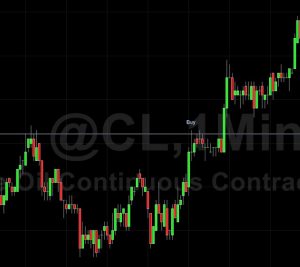
This graph shows that the asset has significant resistance before it breaks through, so a strong buy is recommended in this situation because the break is imminent when there is a lot of movement in the market. In other words, with a lot of volatility before the breakout, as we can see the asset will break through sharply causing a large profit.
Bearish Market
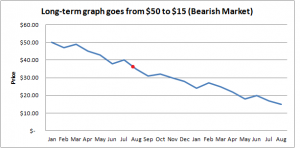
***Buyers are in a weak position because they will have incurred a loss if they bought in at any point on this graph.
Scenario #1:

The best places to sell are when the market recovers a little before it dips again. It is also important to sell after a breakdown, in order to stop the current asset holder’s losses because the asset’s value is highly unlikely to recover after that drop. When there is already a trend of the asset dropping in value and then recovering, it will usually continue in this pattern.
Scenario #2:
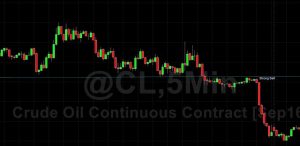
Here we can see there is a lot of resistance before it dips past the break, so it will be referred to as a strong sell in order to prevent sharp losses. For example, before a recession there might be a lot of volatility and then the recession can hit violently, causing everything to drop sharply in value.
Key-Takeaways
Instead of buying and selling blindly it is important to look for trends in the market and make smart trades based on these trends and market conditions.


Leave a Reply