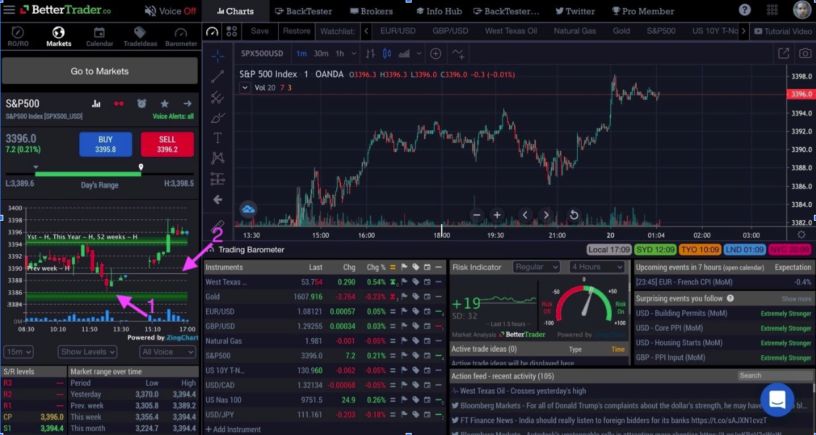
As the S&P 500 reaches highs, how do traders buy and sell to maximize their profits? On a daily basis, the market doesn’t grow linearly, but rather has minor intraday fluctuations as it trends upwards. That being said, traders look to maximize their profits at the margin by buying when these minor fluctuations hit a local minimum (Support) before trending upwards. Later, a trader would sell their stock when it reaches a local maximum (Resistance) before oscillating downwards.
In general, traders use a tool called support and resistance levels, which set estimated targets for the highs and lows of these short fluctuations, indicating when the market will move.
The resistance levels are generated based on past market trends and, with meticulous construction, have proven to make accurate predictions.
However, the levels are hard to implement. Either you can go through the historical data and make calculations yourself, or you can buy from a third party supplier. With third party suppliers, the predictions are far better executed by complex algorithms which can be expensive and inaccessible. Moreover, levels become outdated quickly, so they need to continuously be updated throughout the day. Given the speed and volatility of the market, these solutions are inefficient and ineffective for successful short-term trading.
Given the speed and volatility of the market, these solutions are inefficient and ineffective for successful short-term trading.
The Support and Resistance Level Solution: The Short Term Buy/Sell Decision Made Easy
How can traders make the best-informed decision on their positions given the constantly changing, seemingly impossible to track nature of support and resistance levels in the market? Through a combination of historical data, real-time market analysis, and a tailored algorithm, the Support and Resistance Levels Chart within the Markets tab allows traders to do just that. The software is all-encompassing: with real-time data on fluctuating price levels being sent out to traders four times daily. With the use of this technology, traders can significantly diminish their time (and money spent on intellectual capital) prior to solidifying their positions based on the short term price levels of their assets. Rather than delaying/ guessing about the right levels, traders can be updated with relevant levels given the real-time analysis of the Support and Resistance Levels chart.
Let’s take a look at how levels can help traders navigate the S&P 500.
If we inspect the market’s chart, it includes two meticulously curated estimated support levels, shown as the horizontal green lines. When the market nears that low support level (Arrow 1), it is indicated that probably demand will be placed here and price most likely bounced back.
However, we notice another support level at a higher point. What this indicates is that after the market made a leap upwards around 16:00, the system generated a new support level, displaying the new predicted local minimum, highlighting the dynamic and constantly updating nature of BetterTrader’s technology.
The chart also includes the previous week’s market high, demonstrated by the grey line (arrow 2). Traders can use this information as another data point to compare to the current market and to make better analysis where the buying pressure will be placed.
This look at the S&P 500 is a unique situation. Usually, for a standard market or index, the system also generates resistance levels, highlighted in red. These resistance levels provide the opposite function, namely telling traders when to sell. But the S&P 500 is in a unique state: it keeps reaching all-time highs. Therefore, there is no data to indicate when the market will dip from these highs because it has never happened before. Therefore, the algorithm only provides support levels, helping traders to improve their timing and opportunities.


