


Bollinger Bands are a widely used measure of intermediate price trends. Specifically, these bands can be thought of as adaptive support and resistance levels; rather than simply drawing a line from high-to-high and low-to-low, Bollinger Bands capitalize on the real-time availability of price data to generate a more precise picture of price trends.
How are Bollinger Bands calculated?
Constructing Bollinger Bands begins with the moving average of a security’s price; this moving average can technically be applied to any time period, however, 20 days is most commonly used. Once the moving average is defined, the “bands” are drawn as two standard deviations around that average. This means that any given point on the upper band represents two standard deviations above the moving average at that same point in time. Conversely, the lower band represents two standard deviations below the moving average.
Today, trading software instantaneously computes and illustrates this pattern. Accordingly, the effectiveness of Bollinger Bands does not hinge on how rapidly a trader can calculate the moving averages or standard deviations but on how well they can derive meaning from the indicator. That is, since everyone has immediate access to this tool, traders must possess a strong underlying thesis which can then be confirmed or denied by Bollinger Bands.
What do Bollinger Bands tell us?
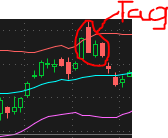
After establishing how Bollinger Bands are calculated, traders can find two primary use cases for them. First, “tags” against either band can signal a reversion in trend. Tags describe instances when the security’s price touches either band but does not actually cross it to any meaningful degree. When these tags occur, it signals that the security is unable to break through the band and will therefore reverse direction. The most obvious sequence to signal a tag-based reversion begins with a tag and is followed by an immediate but shallow price reversal. This is because the immediacy of the price reversal suggests that the bands are indeed binding the price and the shallowness of the reversal suggests that there is more opportunity for trend reversion to occur.
The other use of Bollinger Bands is in identifying a new breakout via a definitive passing of either the upper or lower band. When a security’s price has stayed within both bands for an extended period of time, movement outside of these bands may signal that a new normal is developing. It is vitally important that traders implementing this strategy recognize the difference between a random breakthrough (which is really a tag) and a meaningful breakthrough which signals permanence. This presents a perfect opportunity to utilize the power of backtesting: traders can backtest how accurately Bollinger Band breakouts predicted a new trend in the security they are analyzing. Furthermore, they can backtest the average percentage move outside of each band which was historically required to accurately predict a new trend.
One final application of Bollinger Bands is to provide a visual representation of a security’s volatility. Wider bands represent greater volatility while narrower bands represent greater price stability.
Application of Bollinger Bands
For traders deciding whether to add Bollinger Bands to their respective indicator blends, consider timeframe. Short and medium term traders (intraday and intraweek) are more likely to capture the benefits of Bollinger Bands than those with longer time horizons. This is because the implications of both tags and breakouts will likely be realized after longer time periods. Additionally, the backesting process discussed earlier in this article offers a useful mechanism for deciding whether Bollinger Bands will be effective for a given security. Indeed, the decision to use Bollinger Bands does not have to be binary; it can instead be informed by backtesting the efficacy of the bands on individual securities.
As previously stated, well-known indicators such as Bollinger Bands are unlikely to yield outsized returns on their own; mass availability intrinsically limits the degree of surprise markets will exhibit to changes in such indicators. Having said that, adding Bollinger Bands to an existing strategy may provide valuable information for traders. Although any one well-known indicator is unlikely to provide a meaningful edge, traders who progressively develop their own unique combination of indicators can produce superior results. Essentially, trading follows the old adage that the whole can be greater than the sum of its parts. As traders add uniqueness and depth to the blend of indicators they use, as well as improve their qualitative interpretation of news events, they become more powerful than any one indicator utilized in isolation.