


On June 28, Eyal Mor, the CEO of BetterTrader, presented a webinar with TradeStation. This webinar focused on how BetterTrader service has the information you need and gives traders the ability to analyze and act on it quickly, leading to success. This is done through the use of historical data, predictive analysis, and artificial intelligence algorithms that interpret macroeconomic events as they occur.
An optimized transcript of the webinar follows:
“Hi, my name is Eyal Mor. I am the CEO of BetterTrader. I believe that there is a good way to leverage volatility during economic events for profitable trading. My trading experience comes from being a professional trader for almost 10 years, spending countless hours every day in front of a computer screen focusing on discretionary and algo-trading.
This session will deal with several concepts. The main question is ‘can traders have a competitive edge? And if so, how?’ I believe that in order to have an edge over other traders, we have to use our time wisely, both before an event release and after. Traders can harness statistical models and real-time analysis, rather than just trading in the spur of the moment.

I’m no fortune teller so this session will not be about predicting the future. Instead, I will focus on the process that professional traders go through when trading in the financial markets. This process is based on collecting facts, analyzing them, and then making a firm decision. We need to understand economic events to see their full market effect. It is very useful to know how the market reacted in similar economic events.
Which futures contract reacts most significantly after the release of the unemployment rate in the US market?

Once this event info is released, which future is best to trade, which one of them is the most correlated? Is it “easiest” to trade the S&P 500, currencies, etc.? I will let you think about this for a while and I will get back to it at the end of the session.
Why economic events?

There are many ideas in the market, many opportunities to trade, but why trade economic events? In my experience, there are three major reasons for this:
One of them is the source of volatility. Volatility equals opportunity. We need the market to move in order to profit. A stable market is the worst thing a trader can have because then you are just going to pay commission. Traders need volatility. With economic events, that is exactly what you get.
The second reason is events are pre-scheduled. Events constantly repeat themselves and we know exactly when the next one will be released. But why do we want volatility? This kind of volatility is expected volatility, which we can prepare for before the macroeconomic event. We can trade once it is released. We also have unexpected volatility. A common source of this is Twitter, 140 characters can really help us meet our stop-loss goal immediately without even knowing information about the market. When we know that economic events are going to happen, we can prepare accordingly. Twitter is a source of unexpected volatility – that kind of volatility is not favorable. With Economic Events we know that there will be an opportunity to trade, allowing us to set our system, our desk, and our attention.
The third reason is the recurrence. Economic events repeat themselves. They happen every day, every week, every month. That means we can validate and measure the reaction of the markets. When new information is released, you can see how the market reacted to the same piece of information many times in the past. When a speech is released, you can estimate before – how much the market that you trade is going to be volatile, you can understand the potential market reaction. If there is a terrorist attack, you can predict how the market should react. In reality, we may make very logical predictions but still lose money. In retrospect, we can understand how the market works and why it moves like this. But if we don’t have concrete measurements from past events, we can’t handle future releases successfully in the long run.
How should you trade economic events?

If you have trading experience, you will have also experienced volatility and will know that if you are not prepared for volatility, it can hurt you. So, what’s the catch? In my experience, you have to have an edge to be a good trader, and being a good trader will likely end up being profitable. It’s extremely important to not lose your edge.
You can just interpret and analyze the data in your mind, consuming a lot of mental resources, but there are many other people that can do it automatically. In this situation, you don’t have an edge. It’s hard to rely on your memory when you’re under pressure, and once you add emotion to the mix, effective and efficient trading becomes difficult.
We as traders need to follow a system. It could be a paper system, computerized system, your system, our system, a competitor’s system, it doesn’t matter what it is. What does matter is that the system fits your needs. You just need a system to follow. The system BetterTrader has created is based on collecting facts, market analysis, and then making firm decisions once you understand the landscape and what has happened.
For example, before an economic event, we can try to prepare 15 minutes before with the data given and then split the rest of the preparation into two stages. The first stage is using data covering previous releases to your advantage. This includes basic data, previous releases, expected information releases, and the range of releases in the past 3 years. This can be seen with Natural Gas Storage, an event that is released every week at the same time. The previous number is -152 billion. Everyone has this information, it’s nothing special, but it’s good to be aware of the data before the event is released. For Natural Gas Storage, the range in the past 3 years is -250 billion to 132 billion.

The next stage uses the Surprise Range. Using the surprising range from the past 10 months, we can see that a negative surprise much more likely than a positive surprise. This means that if we see a number that is surprising to the positive side, it’s much more sensitive than a number that is surprising to the negative side.
After that, we want to prepare for after the release. We already understand the landscape, but now we need to prepare for after the release. We can’t promise anything about the future, but as a trader, historical information has proven to be useful. You can also use your own experience, your own system that uses what you’ve seen in the past, and what has happened in similar situations. So, historical data and analysis don’t promise anything, but as a trader, that’s what we have. And we need to deal with it. Otherwise, we have nothing to base our decisions on.
Let’s use Retail Sales in England as an example. The event is going to be released soon, but we don’t know what the release will be. Will it be positive? Negative? We can prepare by simulating the market reaction in pre-set situations. We can simulate positive or negative release, a bit positive, very surprisingly positive, etc. Next, we will want to know how other markets will react to the release. Some of the big ones that we look at include currency, the stock index, OIL, Natural Gas, GOLD, and whatever else is being traded heavily. What you see here is a simulation about the positive surprise in relation to Retail Sales in the past 3 years. We get this analysis and simulation 15 minutes before the release until 90 minutes after.
Using the 12 charts given, we can see that among all the data from the last 3 years, out of 36 releases, only 12 were stronger. You can see that 8 out of 12 times the GBPJPY were on a downtrend. If it’s positive I know what I will trade. I’m not going to trade the GBPUSD or the EURGBP. The same approach can be used with negative releases to get some idea about what instruments are correlated and in which direction. With back-testing, before the release, we will know what instrument we should trade after the release because we prefer to trade the instrument with the highest correlation with this event.
Before event release: Preparation
You can see and explore previous market information before the release. You can do this by yourself in excel through research, but it takes far more time than using a system.
After event release: Real-Time
Once the event is released, you will be in a different situation. For each release, there are three proprietary tools [Surprise Magnitude, Perspective Insight, Statistically Backtested Trade Idea].

Surprise Magnitude
After the release, the more benefits you can extract from the system, the better. Every macroeconomic event has an expected value. Once the event is released, we get the actual value. Let’s say, for the unemployment rate in this case, a higher number is weaker and not good for the economy, but a lower number is stronger. But that’s not the question. If we expect the unemployment rate to be 4.6% and the actual rate is 4.7%, how strong is the 0.1% change in surprise? Why do we care? That’s a good question.
The way that we do this analysis is through measuring the magnitude of the event. How surprising is this release? Is it a bit stronger? Much stronger? Everything behind it is made up of statistical tools that generate the sensitivity measure. This then allows you to calculate the magnitude of any macroeconomic event that is released. Once the event is released, if it’s not as expected, you get the number and the magnitude. It answers the question pertaining to how strong or weak the release is.
Perspective Insight
The other thing is to get perspective. For example, ‘this release is the most positive surprise in the last 3 years.’ This is valuable because you can then see how new releases stand in comparison to more recent ones.
Statistically backtested trade idea
Up until now we just talked about macroeconomic events and the actual numbers, but that’s not really connected to us as traders. At Better Trader we might know that there is some event released by some government entity and that it’s very strong because it’s the highest release in the last 3 years, then we can equip the trader with this information.
The third proprietary tool that we created is the statistically backtested trade ideas. As a trader, you care about the event that was just released, but you care even more about how the market will react to it, how the big players will interpret this release. We can see, for example, the unemployment rate simulated here gives us a negative release. The market 15 minutes before and 90 minutes after is the information that is shown here. Each candle represents one minute. We also know that in 9 out of 11 similar situations, the S&P 500 was on an uptrend with a negative unemployment rate.
Now we jump to the question that we had from the start.
There was a negative unemployment rate released. S&P 500 traders and the big players interpret negative unemployment rate as a good reason to buy S&P 500. If you didn’t see the statistics, you might assume that a negative unemployment would be bad for the S&P500 because it means that there is more unemployment so you would think to sell. But once you see these charts and these statistics, you can say ok maybe there are other things that I didn’t consider. In this case, the interest rates impact the market.
It’s also important to understand the background of the market. In the last 3 years, when the unemployment rate is higher than expected the S&P 500 goes up, and when the unemployment is lower it will go down.

The Backtester allows us to prepare before the event is released. Because of this, we will know no matter which direction the unemployment rate goes what the impact will likely be on the S&P 500 and its futures. When it gets released that the unemployment rate is negative and we know which way to trade.
Another thing that we need to understand after the event release is which asset to buy and sell. It’s important to consider stop loss. What is the right stop loss? We know that there will be an injection of volatility once there is an event release, so what’s reasonable? Stop loss is very complicated. I used to trade so I know that it can often happen that you and I can sit here and both know that the market should go up so we both buy, but one of us will profit while the other gets a stop loss.
Macroeconomic events impact the market greatly; there is a projection of productivity which means that there are a lot of players and new information entering the market. This leads to uncertainty. Let’s analyze the uncertainty and its meaning so that we can use the chart to see how the S&P’s volatility will be affected after the release of a new event. In this stage, volatility is not big when it comes to trading in relation to the unemployment rate. You can think about it having a small stop loss, but in different events and with different instruments you can see that what is reasonable stop loss is only applicable in certain situations and for certain people. In this case EURUSD (4.5 times volatility), it’s too volatile for me. So once the event is released, it’s important to be prepared so you can make an informed decision.

A question we have to ask is what is a reasonable stop loss for this kind of trade? What is a reasonable profit target? Should we expect 20 ticks or should we expect 100 ticks? 0.25% or 1%? What is a reasonable profit for this kind of event? How many times you can see the market is going the right way and then back everything to the zero level? Here we can monitor what is a reasonable stop loss what is a reasonable profit target. What’s the expected volatility?
There are many events in a day. It takes about 5 minutes before the market forgets an event and it becomes no longer important. However, there are some events that will be relevant in the market for a longer amount of time. For example, the unemployment rate and the S&P 500 trade duration is about 90 minutes. As a result, you need to be very cautious after you enter the market. If you choose different instruments or are dealing with different events then it can be faster. It’s not one size fits all, so it’s important to equip traders with these statistics. It is not predictions, it is not a signal, it is statistics. What has happened in similar situations? If the system finds something interesting, it will be in the app. There are situations where there is not much opportunity or volatility, but, sometimes there is huge volatility. USD OIL Inventories are a good example of an event with a lot of volatility. In the past year, OIL Inventories there is no good correlation between the oil and the inventories in the last year, so even if there is an extremely stronger or weaker release, it’s not backed with statistics. So, as a trader, I would like to trade oil, but after similar releases, I see that the market goes up 5 times, does nothing 3 times, and goes down the other 3 times. I’m not looking for places to trade where is a lot of volatility but no statistic significance.
In summary, every macroeconomic event has a good opportunity to trade, and if you’re too scared to trade, you are not fully prepared. Not every economic event is a good opportunity to trade, but there are still several good opportunities to trade on a daily basis. During the week there are several events that you definitely want to at least monitor for the opportunity to trade. And if you’re looking at macroeconomic events, it’s always worth it to be prepared for the release.

If you only take one idea from this session it’s to prepare before you trade because otherwise, you have a low chance of success. The markets today are much more complex than just one positive event causing the markets to go up and one negative event bringing them down. You have to be equipped and prepare, by developing your own system. Something that will keep up with the markets because that is the most important part of trading and will make you more consistent as a trader.
From Preparation to Execution
Now I want to talk about the application and trading in the TradeStation app. The idea is to enter and to give the trader more confidence and backed statistics. Statistics are sometimes just organization, but the idea is that 5 minutes before the macroeconomic event you get notifications and find out everything possible so that if you’re trading, it might be interesting for you.

Your Own Analyst
Two minutes before the trade idea, imagine that you have analysts that sit on the back-tester, simulate many different situations. Slight weaker? Weaker? A bit stronger? All of these cases of macroeconomic magnitudes relate to the release of the unemployment rate. Then we have the release, we expected 4.9, but the actual is 4.6, so in this case, it is much stronger.
This proprietary tool, like much stronger or a bit stronger, is extremely helpful. You don’t need to keep up with the different numbers and every economic event.
The statistics come, 8 out of 10 times oil was on the uptrend after much stronger release. Then you get an understanding of how the market has interpreted this type of release in the past.
During the presentation, you didn’t see how all of it looks on the interface so you can get a better sense of it here and Get Started For FREE. Today you used to see and experience economic events where there is expected value and actual value differ significantly. For example, there are green and red bars with the actual value, which means it’s positive or negative, but then you need to decide whether it’s slightly negative or slightly positive.
The other thing is perspective insights. ‘This release is the most positive surprise in the last 3 years and 5 months.’ This is significant information. Usually, you get this 15 minutes after the release in your news feed or RSS, but it takes the time to process and be delivered. Usually, it’s analysts that do it. This release is the most positive surprise in the last 3 years and you get this once the actual numbers come.
This event was extremely stronger, and it was the most positive surprise in the last 3 years and 5 months. Then you get the statistical back-tested trade idea.
There are many instruments that we can trade after release, the currency, commodities, or the indices. So why don’t we focus on the one with the good statistics that you get in real time? The statistics like 8 out of 10 times oil was in the uptrend in similar situations.
Remember that it’s important to have a system for trading. You can even create your own with a paper and pen but it’s important to have a system and when you have success you can repeat. Trading is hard. Thank you.
Thank you for your time and I will be happy to answer any questions here or personally via email (eyal at bettertrader.co), feel free to contact me.
Update from last week
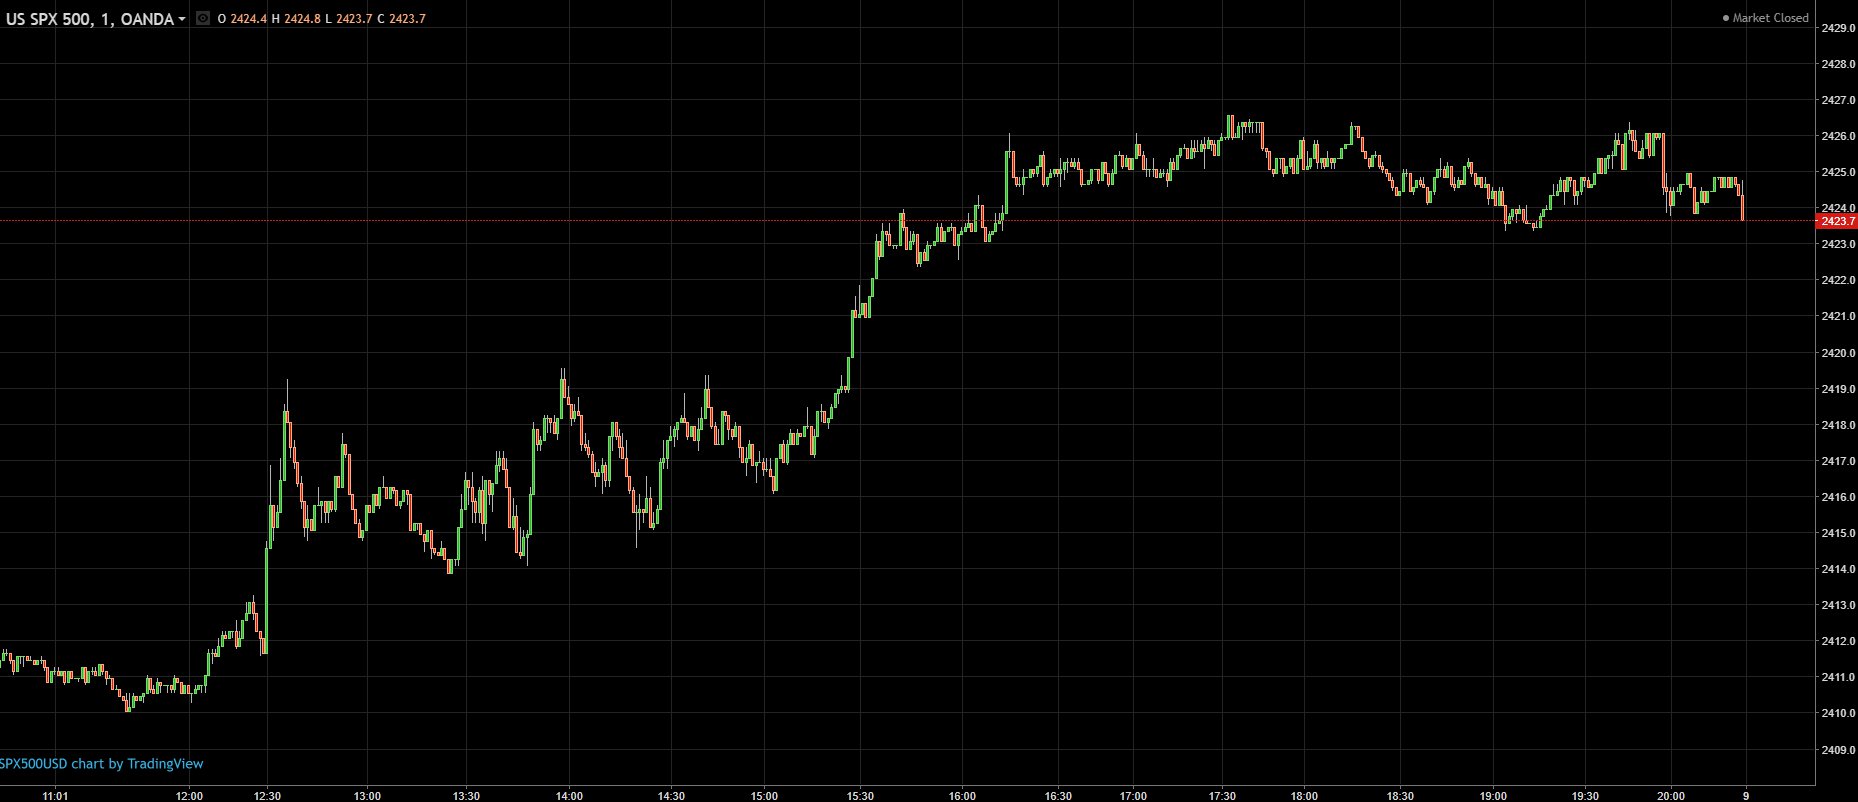
This presentation took place on 6/28/2017 with TradeStation. Last Friday, on 7/7/2017, the US Unemployment Rate was released. The expectation was 4.3% and the actual number was 4.4%.
Here is how it looked in real-time in the BetterTrader app and how the market actually reacted afterward….
We believe that traders need an edge that can only be gained by statistical analysis.